In a significant step forward for dark sky preservation in the Lone Star State, DarkSky Texas is proud to announce the launch of our innovative Texas Sky Quality Meter (SQM) Dashboard. This comprehensive tool significantly advances our ability to track, measure, and combat light pollution across Texas. By providing accurate and timely data on night sky brightness, the SQM Dashboard empowers community leaders, astronomers, researchers, and concerned citizens by equipping them with the information needed to protect one of our most precious natural resources—the dark night sky.
What is the Sky Quality Meter (SQM) Dashboard?
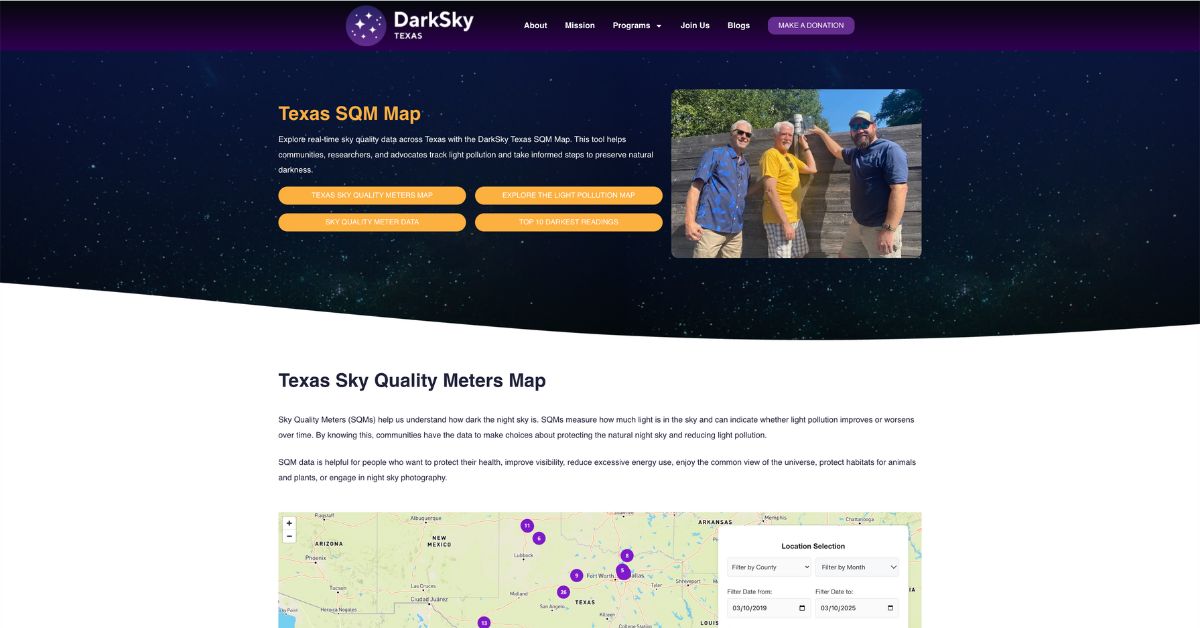
The SQM Dashboard is an interactive platform that displays and analyzes night sky brightness measurements across Texas. At its core, the dashboard collects data from a network of specialized Sky Quality Meters—devices that precisely measure the night sky’s darkness by quantifying the amount of light present.
This data is then provided in a user-friendly, map-based format, allowing you to easily track night sky brightness across time, view its trends, and an area’s night sky quality over time.
What Can You Do with the SQM Dashboard?
This powerful tool offers users the ability to:
- View sky brightness readings from dozens of locations throughout Texas
- Access historical data to identify patterns and trends in light pollution levels
- Correlate the readings in different regions according to the Bortle Scale—a nine-level numeric scale that quantifies the astronomical observability of celestial objects and the interference caused by light pollution
- Generate reports and visualizations that illustrate changes in sky quality over time
Unlike previous monitoring efforts that relied on satellite imagery or sporadic measurements, our SQM Dashboard provides data that accurately reflects observers’ experiences on the ground. This significantly improves our ability to understand and address light pollution in Texas.
Who is the SQM Dashboard For?
The beauty of the SQM Dashboard lies in its relevance to a wide range of users with diverse interests in dark sky preservation:
- Conservationists & Advocates who need to leverage concrete measurements to support conservation efforts or need metrics to measure the success of their previous efforts.
- Local Communities & Policy Makers looking to guide lighting regulations and ordinances.
- Astronomers & Stargazers can identify optimal locations for stargazing and astrophotography, saving time and travel by consulting real-time brightness readings before planning their outings.
- Researchers & Scientists who need standardized data for studying light pollution trends.
Why is This Data Important?
The significance of systematically tracking sky brightness extends far beyond the interests of amateur astronomers. Light pollution represents one of the most rapidly increasing forms of environmental degradation, yet until now, it has been challenging to measure consistently.
Tracking Light Pollution Trends: The SQM Dashboard establishes a crucial baseline for understanding how artificial light changes our nighttime environment. By documenting these changes, we can identify hotspots of light pollution growth and measure the effectiveness of mitigation efforts. Reducing glare and excessive lighting protects human health, saves money, and lets humans see their surroundings better.
Supporting Conservation Efforts: Data from the dashboard provides advocates with powerful evidence when arguing for dark sky-friendly policies. Instead of relying on subjective impressions, dark sky advocates can now point to objective measurements demonstrating the need for and impact of lighting improvements.
Improving Night Sky Visibility: You cannot protect what you don’t measure. The dashboard helps us understand where natural darkness still exists and where it is being threatened, allowing for targeted conservation efforts to preserve starry skies for future generations of Texans.
Enhancing Wildlife Protection: Excessive artificial light disrupts nocturnal ecosystems, affecting everything from insect populations to migratory bird patterns. By identifying areas with increasing light pollution, the dashboard helps prioritize wildlife protection efforts and evaluate the effectiveness of lighting adjustments.
How Does the SQM Dashboard Work?
Behind the user-friendly interface lies a sophisticated system for collecting, processing, and displaying sky brightness data:
Interactive Map Interface: The dashboard presents data on an intuitive map of Texas, with color-coded indicators showing current sky brightness levels. Users can zoom in on specific areas or search for locations of interest.
Data Collection Network: Measurements come from two primary sources—a network of fixed SQM sensors and mobile hand-held meters. DarkSky Texas volunteers and partners maintain the meters and submit the data to us on a regular basis. Each reading includes location coordinates, timestamp, and sky brightness value (measured in magnitudes per square arcsecond).
Bortle Scale Integration: The dashboard provides mapping of the technical SQM readings into the more intuitive Bortle Scale, helping users understand the practical implications of different brightness levels—from Class 9 (the skyglow typical of an inner city, where you can only distinguish the Moon or bright satellites, but no stars at all) to Class 1 (the darkest possible skies on Earth).
Globe at Night Partnership: Most of our data is shared with the international Globe at Night program. Our team works with those contributing SQM data to assist and encourage them to also provide their data to this outstanding international citizen science program..
How You Can Get Involved
The success of the SQM Dashboard depends on widespread participation and support from Texans who value dark skies:
Check Your Sky Quality: Explore the dashboard to understand light pollution levels in your community. Simply visit the DarkSky Texas website and navigate to the SQM Dashboard to see how your neighborhood’s night sky compares to others across the state.
Join the DarkSky Texas SQM efforts and where we also share data with the “Globe at Night” Citizen Science Effort: You can contribute valuable data by participating in both the DarkSky Texas SQM program and the Globe at Night observation campaigns. Both take data from either a SQM that automatically collects data nightly or with a hand-held meter. The DarkSky Texas team has developed configuration and submittal instructions for both methods, as well as personalized help when needed.
Advocate for Dark Skies: Use the information from the dashboard to start conversations about responsible outdoor lighting in your community. Share specific data about your local sky brightness with neighbors, homeowners’ associations, and local officials to encourage adopting dark sky-friendly lighting practices.
Support DarkSky Texas: Consider donating to help expand our mission or volunteer to help organize additional efforts. Your support helps DarkSky Texas continue developing tools like the SQM Dashboard and advocating for dark sky preservation throughout Texas.
A New Era for Dark Sky Preservation in Texas
Launching the SQM Dashboard marks a significant milestone in DarkSky Texas’s mission to preserve our state’s celestial heritage. By transforming light pollution from an abstract concern into a measurable phenomenon, we’ve created a powerful tool for education, advocacy, and policy development.
As development continues to spread across our beautiful state, the importance of monitoring and protecting our dark skies has never been greater. The SQM Dashboard empowers all Texans to become stewards of the night sky, armed with data to make informed decisions about outdoor lighting in their communities.
We invite you to explore the SQM Dashboard today and join us in this crucial work. Together, we can ensure that future generations of Texans will continue to experience the awe-inspiring beauty of a truly dark, star-filled sky.
Visit sqm.darkskytexas.org/ to access the interactive Sky Quality Meter Dashboard and learn more about how you can contribute to this groundbreaking citizen science initiative.